
Wave’s MRP model correctly projected 2026 Democratic wins.
Our district-level estimates came within 2.5 points of the 2026 House results on average and put Democrats at 250 seats.
Wave Polling and Research’s state-of-the-art MRP model, which turns national poll samples into estimates of local opinion, passed a crucial test this week. In this year’s elections for the U.S. House of Representatives, its estimates of the Democratic share of the two-party vote had a mean absolute error of just 2.5 points across the 339 contested districts where at least 90% of the expected vote had been counted as of Nov. 6. The model put Democrats at a median of 250 seats, with a 90% uncertainty interval of 237 to 268. As of Friday evening, the party had won 251 seats and led in eight of the 23 races not yet called.
MRP, short for multilevel regression and poststratification, is how we turn a national survey into estimates for every state, congressional district and smaller area. The model learns from thousands of Wave poll interviews how views vary with age, sex, race, education, income, past vote, party and place. Then it applies those patterns to Census data on who lives in each district. To estimate the House vote among likely voters, we used only interviews completed before the first polls closed, at 6 p.m. Eastern on Nov. 3, and left out every interview conducted after that. So the vote estimates rest only on survey data from before the election. We made these district estimates on Nov. 5 and 6, after the election.
The estimates came within 5 points of the result in 313 of the 339 districts, and half came within 2.1 points. And in 311, the party ahead in our estimate won the race or, where it hadn’t been called, led the count. Of the 28 where it didn’t, 21 had margins under 4 points. That’s in line with how the method did in earlier tests on the 2022 and 2024 House elections.
Estimates and results lined up closely, with a correlation of 0.98.
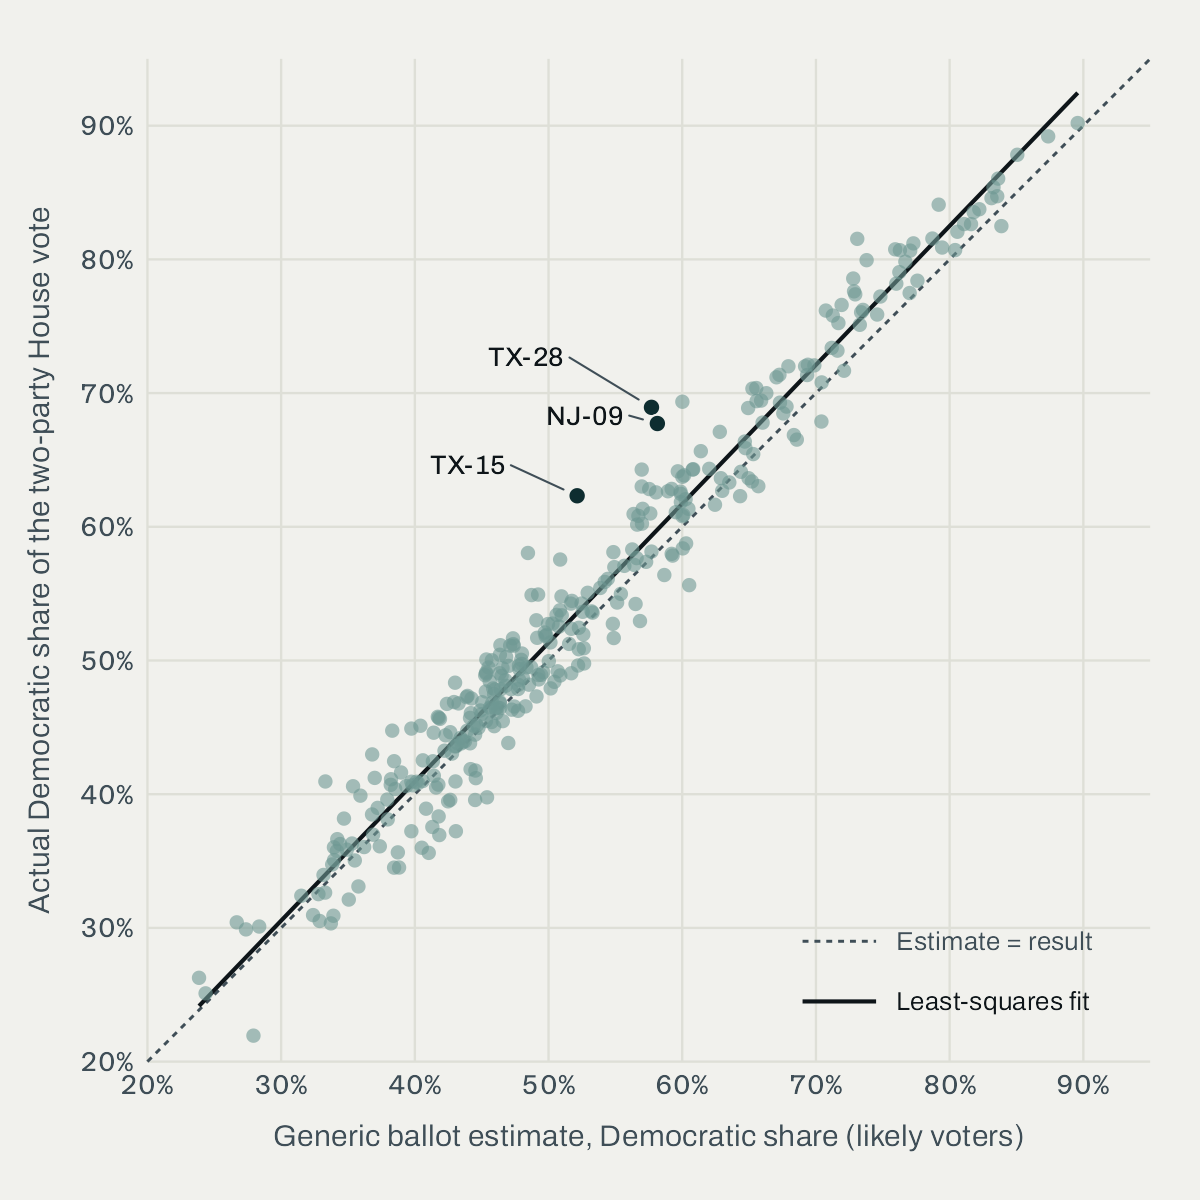
The likely-voter estimates were the most accurate of the three groups we model: the estimates for registered voters missed by 3.1 points on average, and those for adult citizens by 2.8.
The model puts Democrats at a median of 250 seats among likely voters.
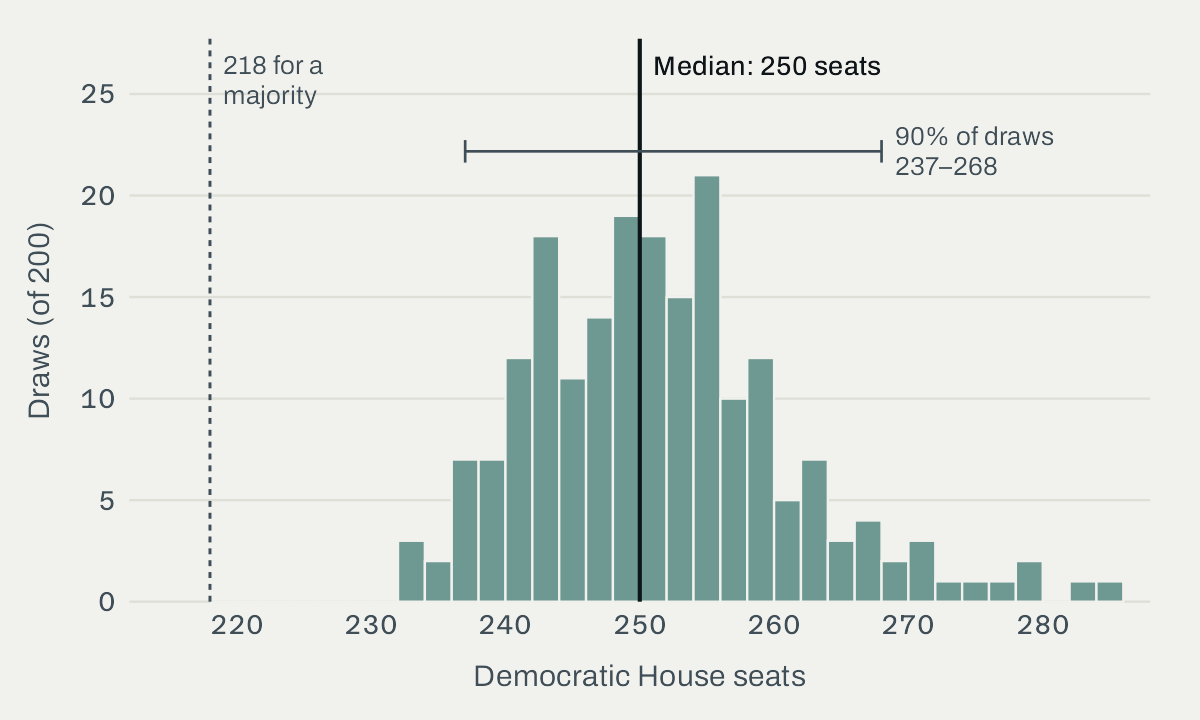
We counted the districts above 50% Democratic in each of 200 draws from the model. For likely voters, the 90% credible interval around the 250-seat median runs from 237 to 268. The median is 240 seats for registered voters and 252 for adult citizens.
As of 8:06 p.m. Eastern on Nov. 6, 251 races had been called for Democrats, one more than our likely-voter median, and 161 for Republicans, with 23 not yet called. And the model gets its seat counts from the generic ballot alone, with no information about candidates, incumbency or uncontested races.
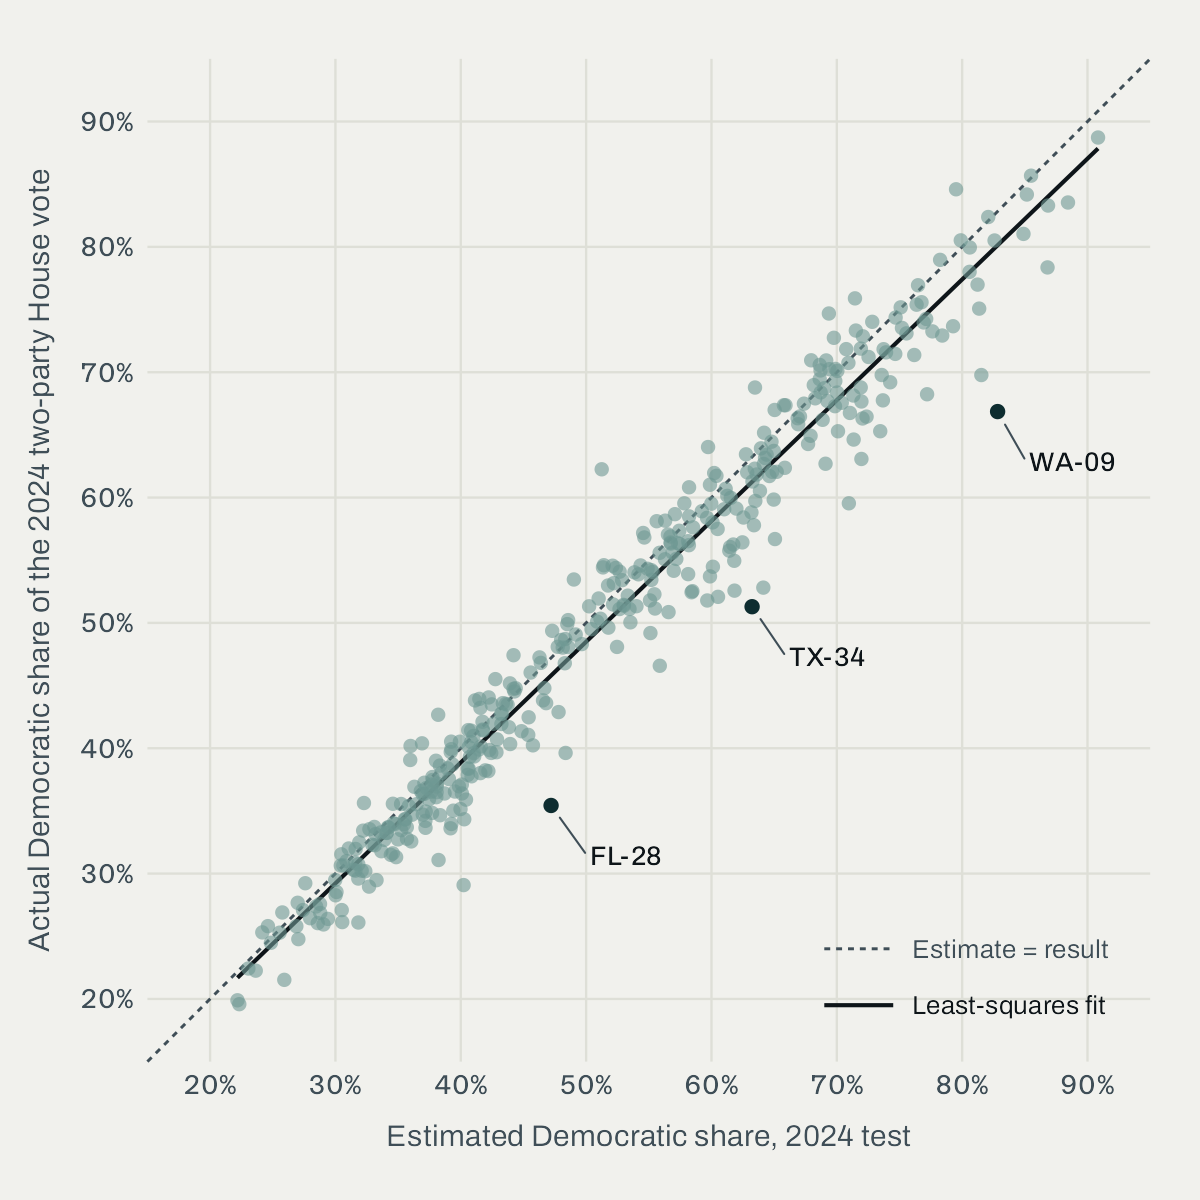
Earlier tests of the method on the 2022 and 2024 House elections gave similar performance.
Before Wave, we tested this method at Strength In Numbers on the 2022 and 2024 elections. Each test fit its vote models to survey data from before the election, mainly the Cooperative Election Study, and weighted the predictions to a population frame calibrated to the 2020 presidential results. The 2022 test reused the frame built for the 2024 test. We then scored the estimates against the certified results (methods paper, PDF).
Those tests reported root-mean-square error, which counts big misses more heavily than the average miss does. By that measure, the 2026 estimates missed by 3.1 points, vs 3.4 in the 2024 test and 3.9 in the 2022 test. The paper also puts the 2024 test’s average miss at 2.4 points, about the same as 2026’s 2.5.
| Measure | 2022 test | 2024 test | 2026 |
|---|---|---|---|
| Districts compared | 320 | 393 | 339 |
| Root-mean-square error | 3.9 pts | 3.4 pts | 3.1 pts |
| Average of result minus estimate | −1.8 pts | −1.6 pts | +1.4 pts |
| Winner matched | 304 (95%) | 386 (98%) | 311 (92%) |
| Competitive districts | 89 | 105 | 150 |
| Root-mean-square error, competitive districts | 3.5 pts | 3.6 pts | 2.5 pts |
The 2026 lead was widest in competitive districts, where the Democratic share finished between 42.5% and 57.5%. There, the 2026 error was 2.5 points, vs 3.6 in the 2024 test and 3.5 in the 2022 test. But the 2026 estimates matched the winner in a smaller share of districts — in a year with many more close races. Competitive districts made up 150 of the 339 in 2026, vs 105 of 393 in the 2024 test and 89 of 320 in the 2022 test. Outside them, the 2026 estimates matched the winner in 188 of 189.
None of the three tests used the results to fit the model. But none is a clean test, either. In 2022 and 2024, we chose some settings by scoring them against the results, and we made the 2026 estimates after the election.
The misses haven’t leaned toward the same party every time. In 2022 and 2024, the results were more Republican than the estimates; in 2026, they were more Democratic.
Statewide, the 2024 test’s root-mean-square error was 1.6 points for president, with all 50 state winners right, and 2.0 points for the Senate, with 32 of 33 winners right. In the 2022 test, it was 3.8 points for the Senate, with all 33 winners right.
The results ran a little more Democratic than the estimates, most of all in heavily Hispanic districts.
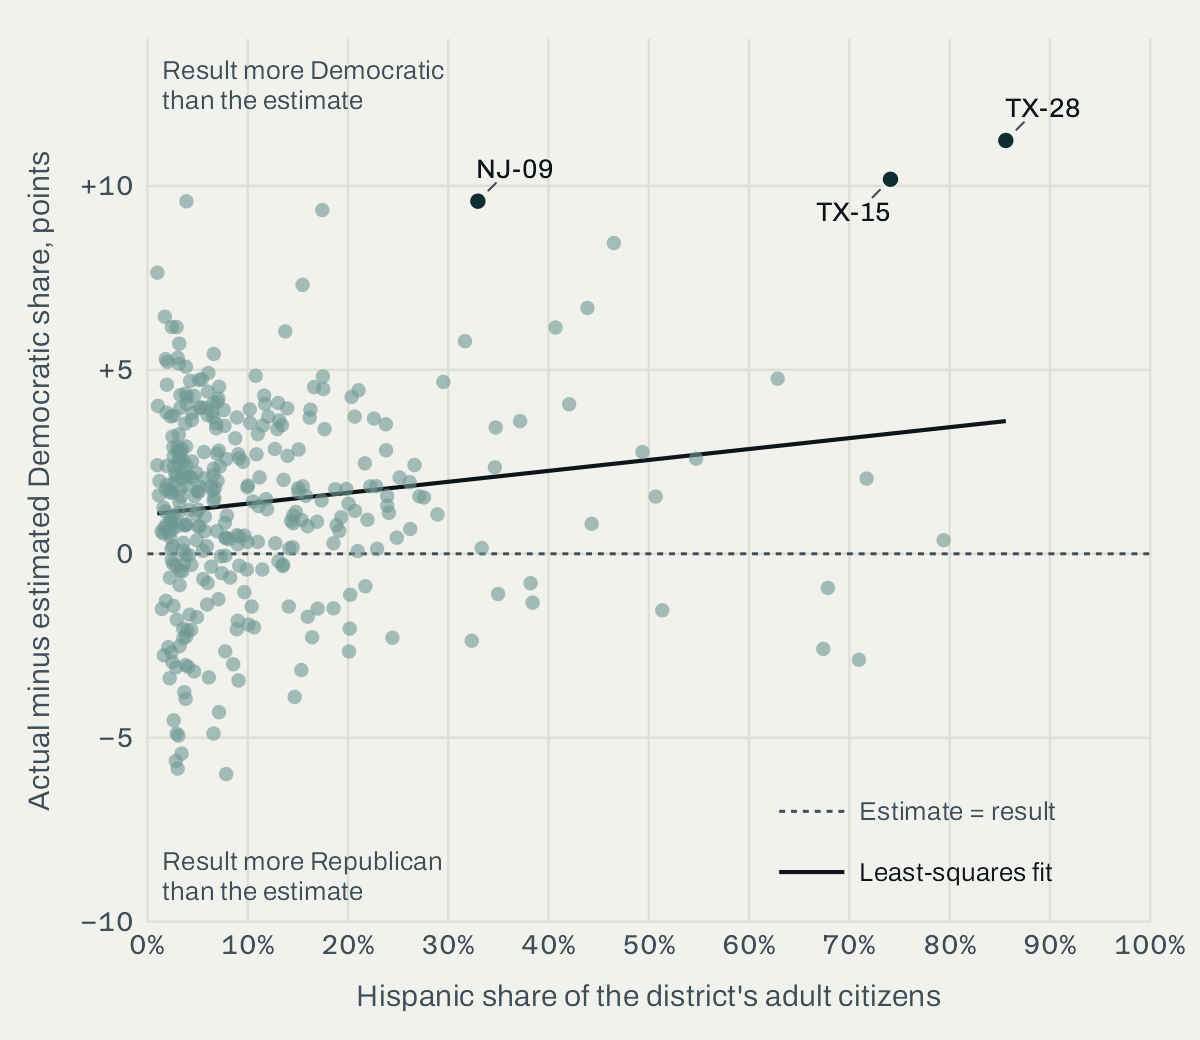
Across all 339 districts, the results ran 1.4 points more Democratic than the estimates on average. The gap was largest in heavily Hispanic districts: 3.2 points in the 17 where more than 40% of adult citizens are Hispanic, against 1.2 in the 212 where fewer than 10% are.
Our MRP model beat the best media forecasting model on four of five measures.
We also checked our estimates against FiftyPlusOne’s final House forecast, run before the polls opened on Nov. 3. A New York Times analysis published Nov. 6, which scored forecasters and prediction markets on the odds they gave in individual races, found FiftyPlusOne’s forecast the most accurate over the whole 2026 cycle, though the prediction markets did better in the final days. G. Elliott Morris leads Wave and builds FiftyPlusOne’s forecasts.
We missed by 2.5 points on average, and the forecast by 3.0. Our estimates, made on Nov. 5 and 6 after the election, were closer to the result in 196 of the 339 districts and in 101 of the 150 competitive ones. They came within 5 points of the result in 313 districts, to the forecast’s 281. But the forecast matched the winner in more districts, 317 to our 311. Our biggest edge came in the 117 districts in states whose lines changed, where we missed by 2.6 points and the forecast by 3.8. In the other 222, we missed by 2.4 and the forecast by 2.6.
| Measure | Wave estimates (likely voters) | FiftyPlusOne forecast |
|---|---|---|
| Average miss | 2.5 pts | 3.0 pts |
| Root-mean-square error | 3.1 pts | 3.9 pts |
| Average of result minus estimate | +1.4 pts | +2.5 pts |
| Within 5 points | 313 | 281 |
| Winner matched | 311 | 317 |
Trump’s approval ran below the Republican House vote in 296 of 339 districts.
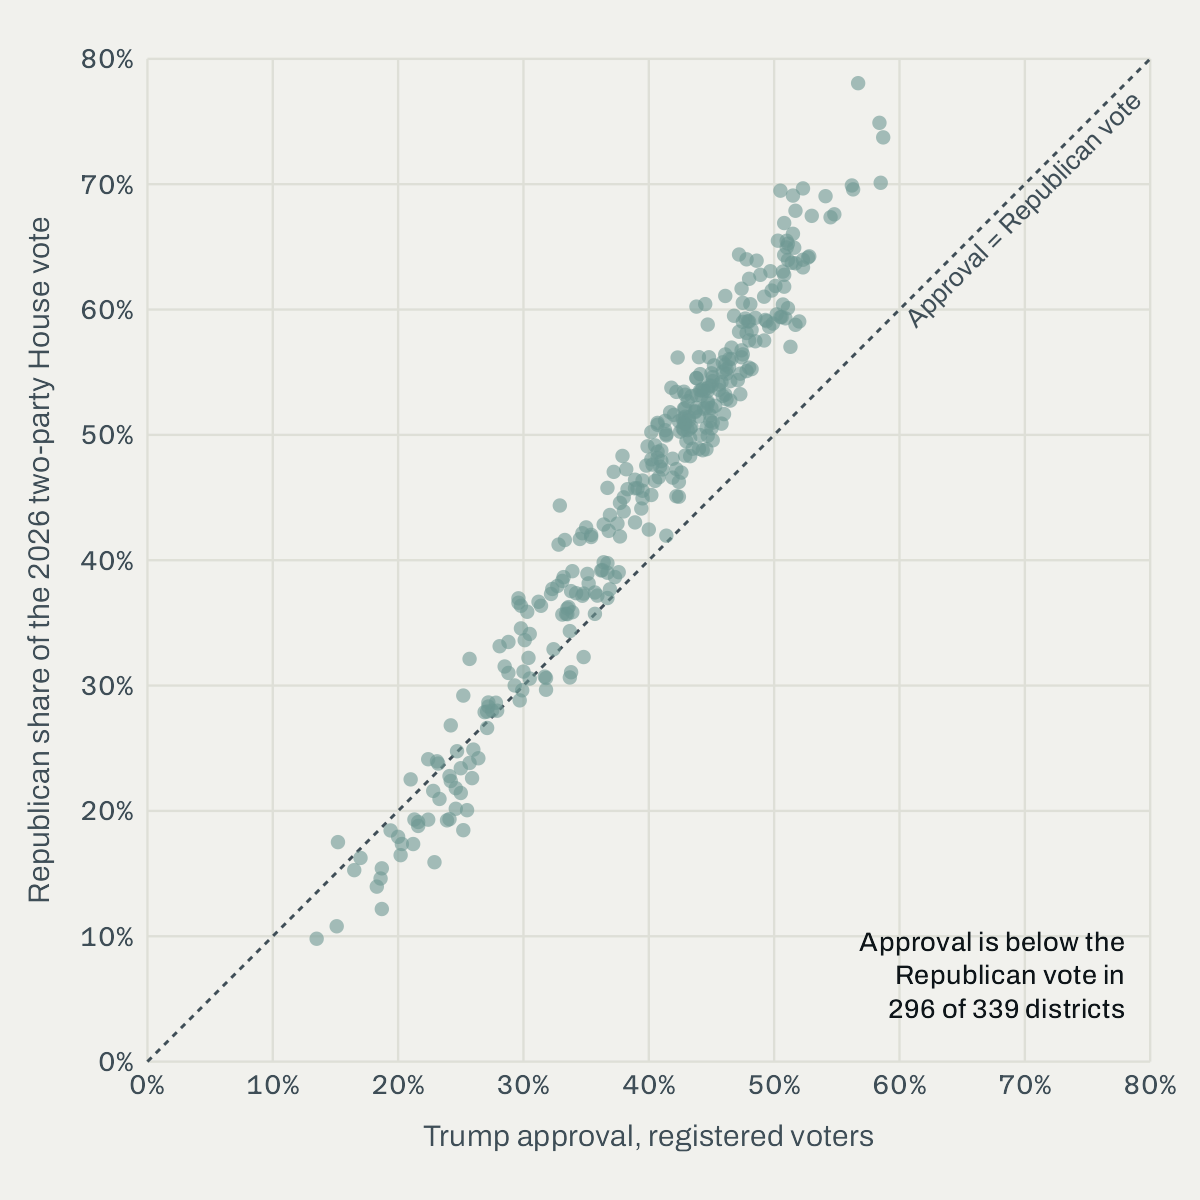
The model puts Donald Trump’s approval at 37.3% among registered voters for Nov. 2–5. District by district, his estimated approval tracked the Republican share of the House vote closely, with a correlation of 0.98. But it was below that share in 296 of the 339 districts, and 6.5 points below it on average across all 339.
Wave Pro. The same model powers the Wave Pro dashboard, which tracks public opinion at the local level. Every week, we refit the model with fresh interviews, and the estimates update automatically for every geography: the nation, all 50 states, all 435 congressional districts and more than 2,400 local areas. Subscribers can follow approval, the generic ballot, policy questions and more in any of them, see how opinion has moved over time, and, on Team and up, download the numbers. See plans and pricing.
Methodology
Data. The Wave poll is an online survey of U.S. adults, fielded by Verasight. This analysis uses four waves: Oct. 5–8, 2026 (5,000 interviews), and Oct. 19–22, Oct. 26–29 and Nov. 2–5 (200 each). The model uses 5,537 of these 5,600 interviews. It leaves out 28 we couldn’t match to a location, 22 from Washington, D.C., and 13 missing income or education. Some panelists were interviewed in more than one wave.
Questions. The generic ballot asked, “If the 2026 general election for Congress were held today, which party’s candidate would you be more likely to vote for in your local Congressional district?” Respondents who weren’t sure were asked which party they lean toward, and we count leaners with that party. The generic-ballot estimates use only interviews completed before the first polls closed, at 6 p.m. Eastern on Nov. 3, and only the 4,985 interviews in which the respondent picked or leaned toward a party. The approval question asked whether respondents approve or disapprove of the way Donald Trump is handling his job as president. Approval is the share approving among the 5,379 interviews in which the respondent approved or disapproved.
Model. The estimates come from a dynamic multilevel regression and poststratification (MRP) model fit to all four waves together. It predicts each answer from age, sex, race, education, income, recalled 2024 vote, party, state and local measures. It lets the national level change from week to week, and the state and demographic effects change from month to month. We weight the predictions to a population frame of adult citizens from the Census Bureau’s American Community Survey, matched to the certified 2024 results and to party identification from the Pew Research Center’s National Public Opinion Reference Survey. Figures are for the final week: Nov. 2–3 for the generic ballot and Nov. 2–5 for approval. Intervals are 90% credible intervals, and seat counts summarize 200 posterior draws. Neither includes uncertainty about who votes or error from nonresponse, coverage or question wording.
Likely voters. Likely-voter estimates weight each person by a modeled chance of voting, based on validated turnout in the 2018 and 2022 Cooperative Election Study. We set the electorate to resemble 2018’s, with half of eligible adults voting and 2018’s Black share and age mix, as estimated by Catalist.
Model changes. On Nov. 5 and 6, when we made the district estimates, we also updated the model. We matched the likely-voter electorate to 2018’s Black share and age mix; corrected the population frame’s 2024 electorate, which had too few Black and young voters; added the Nov. 2–5 wave; and moved the district estimates to the 2026 lines.
Districts compared. The estimates use the lines in effect for the Nov. 3, 2026 election, from the Census Bureau’s 120th Congress files. We compare the 339 districts where a Democrat and a Republican each received at least 5% of the vote and at least 90% of the expected vote had been counted, by the Associated Press estimate that The New York Times publishes. That leaves out uncontested races, three races with no Republican on the ballot (MA-01, NJ-08 and PA-03) and AZ-03, where the Republican was a write-in with 1.1%. No district in California or Alaska had reached 90% counted, and only one each in Maryland, Utah and Washington had, so the 339 are not a random sample of the 435. In Louisiana, which held an all-party primary, we add together each party’s candidates. All vote shares are two-party shares.
Earlier tests. The 2022 and 2024 figures are from G. Elliott Morris, “Accurate Local-Level Estimation of U.S. Public Opinion” (Strength In Numbers, July 2026). The 2024 test covers 393 districts with a contested major-party race, leaving out the six states with a single district. The 2022 test covers 320 contested districts, leaving out those six states and the six that redrew their maps between 2022 and 2024 (Alabama, Georgia, Louisiana, New York, North Carolina and Ohio). A district is competitive, as in the paper, if the Democratic share of the two-party vote finished between 42.5% and 57.5%.
Forecast benchmark. The FiftyPlusOne figures are each district’s median Democratic share of the two-party vote from its final House forecast, run early on Nov. 3, 2026, before the polls opened. The forecast put the Democratic side of LA-02 at 99.5% of the two-party vote, with no uncertainty, against 84.1% in the count. Leaving out Louisiana doesn’t change the forecast’s average miss of 3.0 points. The states whose district lines changed between the 2024 and 2026 elections are Alabama, California, Florida, Louisiana, North Carolina, Ohio, Tennessee, Texas and Utah; none of California’s districts is in the comparison.
Sources. House results are from The New York Times as of 8:06 p.m. Eastern on Nov. 6, 2026, when about 93% of the expected national vote had been counted. Counting continues, and these numbers may change.
- Field dates
- Oct. 5–8, Oct. 19–22, Oct. 26–29 and Nov. 2–5, 2026
- Sample
- 5,600 interviews; 4,985 in the generic-ballot estimates
- Universe
- U.S. adults; estimates for adult citizens, registered voters and likely voters
- Mode
- Online, Verasight panel
- Model
- Dynamic MRP
- Results as of
- Nov. 6, 2026, 8:06 p.m. ET (The New York Times)